 Meet Neo, your AI-powered Co-GP.
One screen that answers "how is my investment doing?"
When an LP logs in, the dashboard is the first thing they see. Covercy One opens on a live portfolio map, a cash-flow chart, and the numbers every commercial real estate investor asks about — across every deal and fund — so they stop asking you.
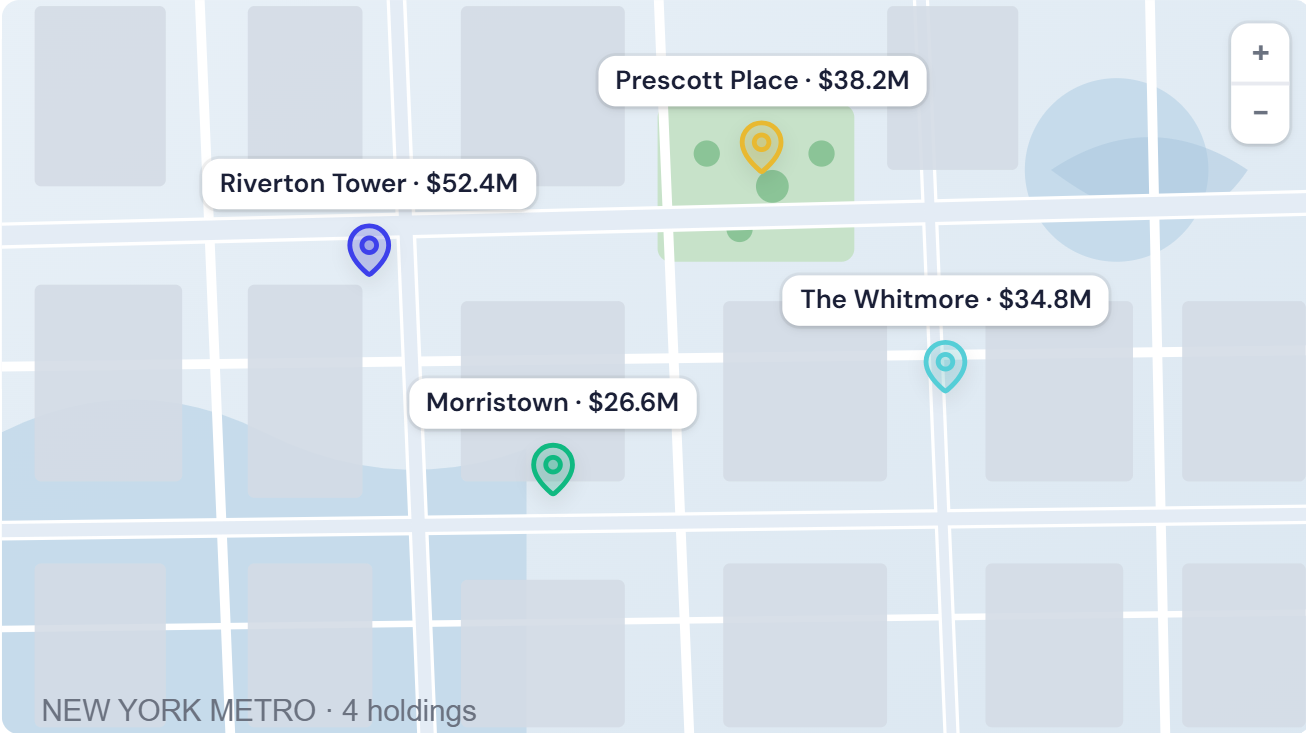
Every position and entity, in one view
Investors who back more than one of your deals should not have to log in deal by deal. The Covercy One dashboard consolidates every holding into a single portfolio view, so an LP sees their whole relationship with you at a glance, no matter how many syndications or funds they are in or how many entities they invest through.
- A live portfolio map of every asset they hold with you
- Total invested, distributed, and current value across all positions
- Consolidated across every syndication, fund, SPV, and entity (individual, trust, or family office)
- One click to drill into any single holding
The numbers investors actually ask about
Performance is front and center, not buried in a PDF. The dashboard surfaces the metrics that drive investor confidence, updated from live deal and fund data, so your LPs always have a current, trustworthy answer without emailing your team.
- Contributions and distributions to date
- Current value and NAV
- IRR and equity multiple
- Recent activity: contributions, distributions, and account updates

Fewer "quick questions," more time to raise
Every status email an investor does not have to send is time you get back for your next raise. A dashboard your LPs trust makes you look institutional from your first syndication, and it is the kind of professional experience that turns one-time investors into repeat capital.
You control what every investor sees
The dashboard your LPs open is driven entirely by your live data and the settings you choose.
Always current
The dashboard reflects your live deal and fund data. As contributions, distributions, and valuations change, the investor view updates with them — nothing to compile or send.
You decide the access
Turn the portal on per deal and set granular permissions, so each investor sees exactly their positions and entities, and nothing else.
Branded as your firm
Your logo and colors carry through the dashboard, reports, and emails, so the experience looks like you, not like software.
Powered by the rest of Covercy One
The dashboard is one piece of the platform your investors and your team run on every day.
Neo, your AI Co-GP
The AI layer that drafts investor updates, runs reports, and automates workflows across Covercy One.
ExploreFundraising
Take investors from interested to funded with online subscriptions, accreditation, and one-click ACH.
ExploreDistributions
Calculate, approve, and pay distributions to the cent, then reconcile automatically.
ExploreInvestor dashboard questions
- What does an investor see when they log in?
- A personalized dashboard that opens on a portfolio map of their holdings, a cash-flow chart, and headline metrics like total contributions, distributions, current value, IRR, and equity multiple, plus a recent-activity feed. They can drill into any single investment for full detail.
- Can an investor see all their investments with me in one place?
- Yes. The dashboard consolidates every position an investor holds with you across all funds and SPVs, so investors with multiple commitments see their entire relationship with your firm in a single view rather than one deal at a time.
- Is the data real-time?
- The dashboard reflects the same live data your team works from in Covercy One. As contributions, distributions, and valuations update, the investor view updates with them, so there is no separate report to compile or send.
- Can investors who use trusts or multiple entities manage everything from one login?
- Yes. A single investor login can span individual, trust, and family-office entities, and investors can grant permissioned access to trusted parties like a spouse or accountant without you having to manage extra accounts.